
Ad Astra Blog
Astronomy ABCs: F is for the Faber-Jackson Relation and the Fundamental Plane
Aaaaaaand we’re back to regular programming, which means another post in my Astronomy ABCs series. This month we are on the letter F, and what other topic could I possibly choose than the Faber-Jackson Relation and the Fundamental Plane (two “F”s for the price of one!).
Aaaaaaand we’re back to regular programming, which means another post in my Astronomy ABCs series. This month we are on the letter F, and what other topic could I possibly choose than the Faber-Jackson Relation and the Fundamental Plane (two “F”s for the price of one!).
The Faber-Jackson Relation
Way back in the old days of 1976, two astronomers - Sandra Faber and Robert Jackson - published a paper called “Velocity dispersions and mass-to-light ratios for elliptical galaxies.” In this paper they studied 25 elliptical and lenticular galaxies and they realized that the measured velocity dispersions correlated with the absolute magnitude (or luminosity) of the galaxy. In plot form, it looks like this:
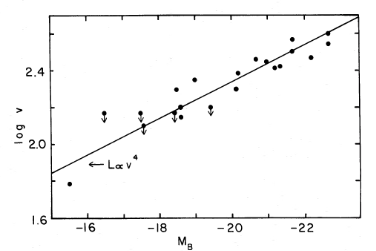
Figure 16 from the Faber & Jackson 1976 paper. Line of sight velocity dispersions are on the y-axis. Absolute magnitudes in the B band are on the x-axis.
Alas, I have used terms like “absolute magnitude” and “velocity dispersion.” I suppose I should explain what those things are before we move on.
Luminosity/Absolute Magnitude
Luminosity and absolute magnitude are related concepts, and often are used interchangeably in astronomy, so it makes sense to talk about them together.
Luminosity is can be thought of as how bright something is, while absolute magnitude is how bright something appears to be from a standard distance (in astronomy that distance is 10 pc). Luminosity is a measurement of how much energy is being released per unit time. If we’re talking about something like a light bulb, it’s luminosity would me reported in Watts. In astronomy, we talk about luminosity in terms of how it compares to the Sun (“solar luminosity).
Absolute magnitude is a measure of an object’s luminosity. It’s how bright the object would look if we were 10 pc away from it. (As far as I know, this 10 pc is arbitrary, but you have measure against something.) It’s measured on a logarithmic scale. If two objects have a difference of 5 magnitudes in brightness, that actually means that the ratio of their luminosities is 100. Also, the lower the absolute magntude is, the brighter it is. Something with a negative absolute magnitude is brighter than something with a positive absolute magnitude. It’s all a little messy, but these are both measurements of how bright something is. Not to be confused with apparent magntude, which is how bright something looks, which can vary a lot with distance and other things (think about how a light bulb looks dimmer when it’s far away compared to when it’s right next to you).
Velocity Dispersion
I think most of use have some experience with bright things. Light bulbs, the Sun, my personality…luminosity and apparent magnitude might not be the words we use every day, but the concepts are familiar. That probably is not the case with velocity dispersion.
Let’s think about a single star. It will have a spectrum that might look something like this:
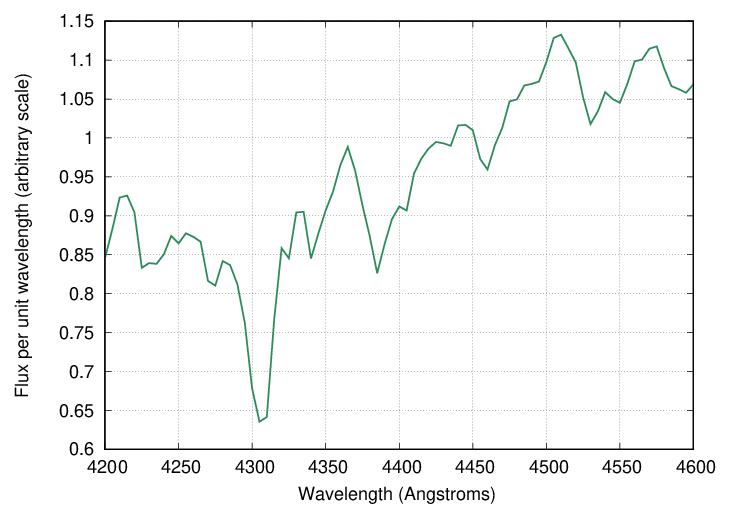
Sample stellar spectra taken from here. The y-axis is basically how much light is being detected and the x-axis is the wavelength of light. This type of graph shows how much light is coming through at each wavelength.
This is zoomed in and only shows a small range of wavelengths, but that’s fine.
This is great, but everything in the Unvierse is moving relative to us here on Earth. This causes the spectrum to undergo a Doppler shift, which will shift the spectrum to either bluer or redder wavelengths, depending on it’s velocity. If the star is moving toward us, the light will look bluer. If it’s moving away the light will look more red. Below is how the spectrum seen above would compare to those shifted values:
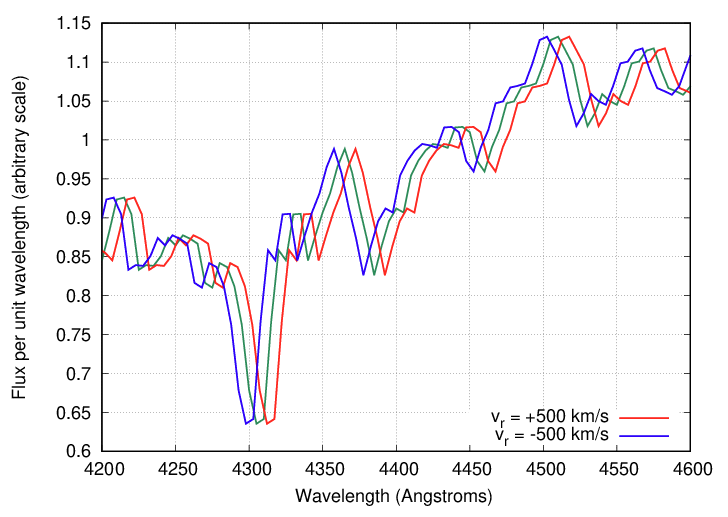
Doppler shifted spectra taken from here. Axes are the same.
The blue line represents a star moving toward us at 500 km/s, the green line is the original star that we assume is not moving relative to us at all, and the red line is a star moving away from us at 500 km/s. The amount of shift we see is very dependent on how fast the star is moving, but you can kind of see what I’m talking about. The movement shifts the spectra.
Getting spectra from an astronomical object is a wonderful thing. A spectrum is like a fingerprint. Every atom and molecule has distinct lines (those dips and peaks). They are so regular that we can name what an object is made of, just by looking at the spectral lines. If those lines are shifted from where they would be normally, we know the object is moving.
This is fine for an individual star, but how does this work with galaxies. Galaxies are combinations of millions or billions of stars. In elliptical galaxies, those stars are orbiting the center of the galaxy is random directions. Some are on a part of their orbital path that moves toward us, some are moving away. Some are only moving sideways. When we get a spectrum of a galaxy, we get a combination spectrum of all of the galaxy’s stars. Calculating the velocity dispersion of a galaxy is kind of like plotting the velocities of all the stars in it and figuring out the standard deviation of that distribution.
The Faber-Jackson Relation, revisited
What Faber and Jackson did in their 1976 paper was measure the velocity dispersions and absolute magnitudes of several elliptical galaxies and found that they correlated; that is, galaxies with larger velocity dispersions also tended to be more luminous.
What’s cool about this is that you can use it to calculate extragalactic distances. Distance measurement has always been kind of pain in astronomy. Things are so.far.away. One way we can calculate distance is through something called the distance modulus:
m - M = 5 log(d) - 5
where m is the apparent magnitude (how bright something looks), M is the absolute magnitude (how bright something is), and d is the distance you want to find. Figuring out how bright soemthing looks is easy. Figuring out how bright something is…well, that’s tougher. But with the Faber-Jackson Relation, if we can measure the velocity dispersion of a galaxy, we can make a pretty good estimation of it’s absolute magnitude, and from there all we have to do is plug and chug and we have a not-too-bad estimate for distance!
Fundamental Plane
Faber and Jackson also found a correlation between velocity dispersion and mass-to-light ratios. The mass-to-light ratio is the ratio of the total mass of a galaxy (normal matter, no dark matter) and the total energy output of the galaxy (it’s luminosity). Faber and Jackson found that the more luminous the galaxy, the higher its mass-to-light ratio. And since they also found that luminosity is positively correlated with velocity dispersion, we now know that the larger the velocity dispersion, the larger the mass-to-light ratio.
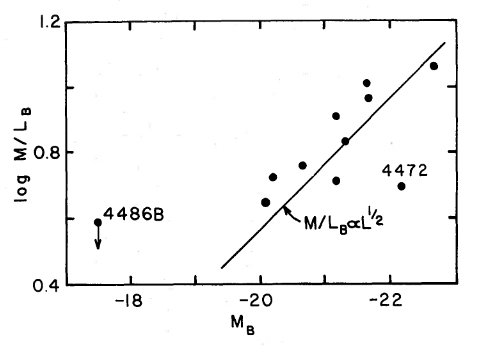
Figure 17 from the Faber & Jackson 1976 paper. Mass-to-light ratios are on the y-axis. Absolute magnitudes in the B band are on the x-axis.
A lot of characteristics of normal elliptical galaxies have shown to be correlated, including the radius of the galaxy, its surface brightness, as well as velocity dispersion. Because there are three variables instead of just two, astronomers call this the fundamental plane (apparently coined by Djorgovski & Davis 1987). Any two variables can predict the third. Amazing!
These findings are a big deal in extragalactic astronomy. It showed that normal (non-dwarf) elliptical galaxies are a class of object all their own.
Featured image credit: Elliptical Galaxy IC 2006 by ESA/Hubble

Astronomy ABCs: B is for Blackbody Radiation
Ah, hello. It is a new month and here I am, trying to fulfill the promise I made to myself to write about astronomy every month. Rather than try to come up with something very clever to write about, I decided to use the English alphabet to guide my way. Last month - the first month of this journey - was A, which of course stands for Astronomy. As is customary, B follows A, so this month let’s dig into blackbody radiation.
Ah, hello. It is a new month and here I am, trying to fulfill the promise I made to myself to write about astronomy every month. Rather than try to come up with something very clever to write about, I decided to use the English alphabet to guide my way. Last month - the first month of this journey - was A, which of course stands for Astronomy. As is customary, B follows A, so this month let’s dig into blackbody radiation.
So…what’s a blackbody? A blackbody is an object that absorbs all light that hits it and emits thermal radiation. Atoms in the blackbody will start to heat up and vibrate faster and faster. As it heats up it will emit electromagnetic radiation - aka light - until the absorption and emission are in balance, i.e. it is in thermal equilibrium with its surroundings.
The radiation from a blackbody has three characteristics that make it useful in astronomy. Check out the plot I shamelessly stole from the OpenStax Astronomy textbook.
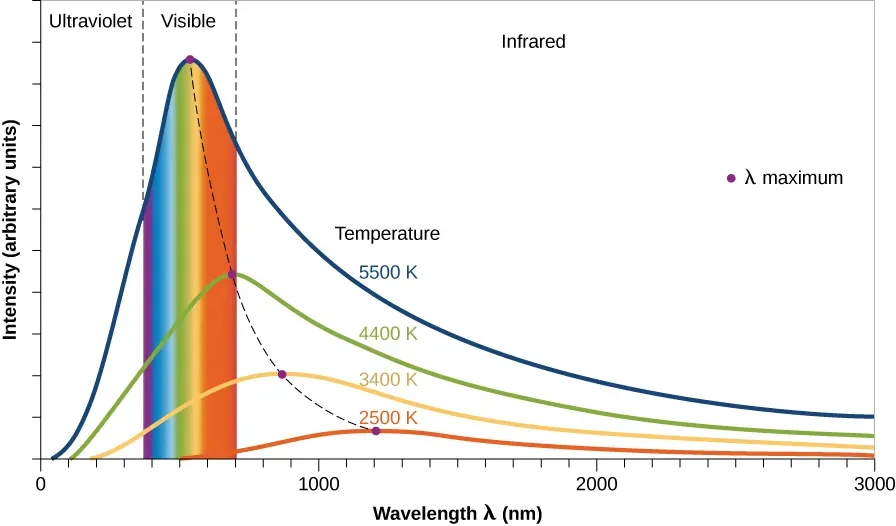
Blackbody radiation illustrated for several temperatures.
This plot shows the blackbody radiation curve for different temperature objects. The vertical axis is intensity - basically how many photons our objects are emitting - and the horizontal axis is wavelength.
There are a few things to notice about the blackbody radiation curve:
First, the spectrum is continuous. These blackbodies are emitting photons at all wavelengths at once (but not all equally, which is important). These blackbodies are just bundles of atoms and molecules. These atoms and molecules will vibrate and bump together at varying speeds. Some will slower than average, some will be faster than average, but most will emit energy at some average value (the peak in the plot). But it’s the spread of these energies that gives us the blackbody spectrum we see.
Second, hotter blackbodies emit more radiation at all wavelengths compared to cooler blackbodies. This is because hotter atoms and molecules vibrate and collide more often, which causes them to give off more energy.
Third, check out the peaks of each temperature blackbody. Other than the height of the curve, what jumps out at you? To me what jumps out is the shift of the peak redward as the temperature of the blackbody goes down. In other words, the peak of the blackbody moves to higher (redder) wavelengths as the temperature decreases.
How does all of this help us with astronomy? Well, it turns out that stars emit radiation like a blackbody! This means that we can use what we know about the blackbody curve to make a thermometer for stars.
There’s a nice mathematical relationship between the wavelength that has the highest intensity in a blackbody and the temperature. It’s one of those important equations that gets a name: Wien’s Law:

This says that the wavelength of maximum intensity (in nanometers) is equal to a constant divided by the temperature (in Kelvin). What this allows us to find the temperature of a star by just measuring its spectrum!
This also means that the color of a star can stand in as a rough approximation of its temperature. Light gets more energetic as its wavelength decreases, and each wavelength corresponds to a particular color. Stars with a max intensity at low wavelength will have hot temperatures, and stars with a max intensity at large wavelength will have lower temperatures. The smaller the wavelength, the bluer the light, and the longer the wavelength, the redder the light. So if we wanted to compare the temperature of a star that appears red to the temperature of a star that appears blue, we could say that the blue star is hotter than the red star just from color alone! Pretty cool!
I got this post in just under the wire for October, but I did do it. I don’t need your praise, I’ve clapped for myself. I hope you stop by next month for more ABCs of Astronomy.

Astronomy ABCs: A is for Astronomy
I used to write the way I breathe. It was effortless. I would have a thought and I would write it down, which changed very little in the distance between my head and my fingers. I haven’t written much in a while, though I’ve tried to create systems that encourage it. I really did want to learn and write a bunch about Venus, but…well. You can see how that turned out.
I used to write the way I breathe. It was effortless. I would have a thought and I would write it down, which changed very little in the distance between my head and my fingers. I haven’t written much in a while, though I’ve tried to create systems that encourage it. I really did want to learn and write a bunch about Venus, but…well. You can see how that turned out.
Part of my job is writing a monthly public science talk. Every month I choose a topic and write a roughly hour-long presentation on it. I script out every talk. I know that this isn’t necessarily “good” practice among scientists, but I do it for a couple of reasons:
I get really nervous when I’m speaking. A script is like a security blanket. If/when I get so nervous that I forget the point of the slide, I have something to fall back on.
The script is a little gift to future me. Once a talk is written, I’ll give it whenever. It’s on the schedule for a certain month but if a group wants to hear it 4 months later, who am I to say no? I write a script because I know I am forgetful. A script allows me to pick up the talk months later and know exactly what I meant to say.
It just helps me weave a story. The flow from slide to slide is better.
I’ve been in this position for a little over 2.5 years and I’ve written 36 individual talks, most of them hour-long public lectures. I was curious to see how much writing a year of public lectures was, so I counted up every word of each of the 12 scripts I wrote in 2024. The result: 65,491 words. A 200 page book - depending on page size and formatting - is 50,000 to 60,000 words.
Ah! No wonder I haven’t been writing more on my own! I wrote a book last year. And, since my 2025 lectures are roughly the same length as my 2024 lectures, I’m sure I’m well on my way to writing a book this year, too.
I really thought I had lost any skill I had as a writer because I couldn’t turn it on at a moment’s notice. But seeing the amount I wrote last year compiled in one place made me think that maybe I’m just trying to force myself to write about things that don’t fit into my life right now. If I may say so, the lectures I wrote are good. I think I explain complex things pretty well to a lay audience.
All of this was a long preamble before introducing a new series: Astronomy ABCs. Every month gets a letter and I will write at least one piece on an astronomical concept that begins with that letter. Why should you trust me when I have failed so many times before? I don’t know, maybe you shouldn’t. But I did spend an hour yesterday making a list of topics organized alphabetically. Do with that what you will.
The best place to start in the alphabet is the beginning, and for English that letter is A. A is for Astronomy.
And listen, I thought about this. A could have been for Accretion Disks. Or AGN. Or Asteroid. Or Airy Disk. But if I’m going to start a series of astronomy-themed posts, I thought it might be a good idea to talk about what astronomy is.
Astronomy (or astrophysics, if you prefer) is the scientific study of space and the objects and phenomena we see there. It brings together physics, math, chemistry, geology, and computer science to figure out how galaxies, planets, and the Universe itself works. There are many subfields in astronomy - cosmology, extragalactic astronomy, planetary science, exoplanet astronomy, stellar astronomy, the list goes on - but if it studies something in space, I consider it under the umbrella of astronomy.
Astronomy is also incredibly old. Early civilizations used observations of the sky to keep track of days, months, and seasons, many developing a complex mythology that encodes generational astronomical knowledge.
With a few exceptions, astronomy is an observational science. At least right now, we can’t travel to a nebula and gather a sample of cosmic dust and gas to study. We need to view our subjects from afar using telescopes that are sensitive to different wavelengths of light. The closest we can get to bringing a bucket of star back to Earth is using telescopes to gather light from far off objects as it travels in our direction.
Over the next several months I plan to write explainers on astronomical topics ranging from the small to the very, very large, from close by to very far away, from massless to massive. Some topics I’ve identified are topics I know well. Others…less so. If I do this right then we all learn something.
Next month is the letter B. What will I write about? Black holes? Blue stragglers? The Big Bang? Something else? Check back to see!