Astronomy ABCs: B is for Blackbody Radiation
Ah, hello. It is a new month and here I am, trying to fulfill the promise I made to myself to write about astronomy every month. Rather than try to come up with something very clever to write about, I decided to use the English alphabet to guide my way. Last month - the first month of this journey - was A, which of course stands for Astronomy. As is customary, B follows A, so this month let’s dig into blackbody radiation.
So…what’s a blackbody? A blackbody is an object that absorbs all light that hits it and emits thermal radiation. Atoms in the blackbody will start to heat up and vibrate faster and faster. As it heats up it will emit electromagnetic radiation - aka light - until the absorption and emission are in balance, i.e. it is in thermal equilibrium with its surroundings.
The radiation from a blackbody has three characteristics that make it useful in astronomy. Check out the plot I shamelessly stole from the OpenStax Astronomy textbook.
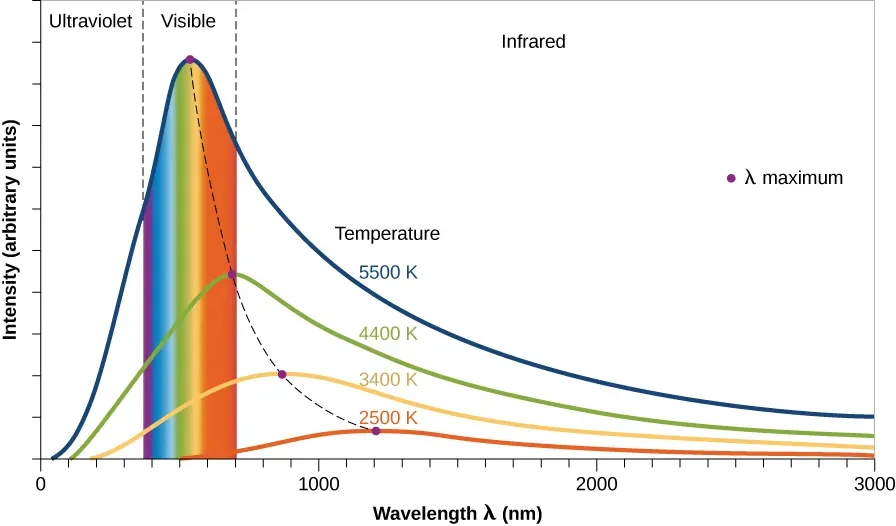
Blackbody radiation illustrated for several temperatures.
This plot shows the blackbody radiation curve for different temperature objects. The vertical axis is intensity - basically how many photons our objects are emitting - and the horizontal axis is wavelength.
There are a few things to notice about the blackbody radiation curve:
First, the spectrum is continuous. These blackbodies are emitting photons at all wavelengths at once (but not all equally, which is important). These blackbodies are just bundles of atoms and molecules. These atoms and molecules will vibrate and bump together at varying speeds. Some will slower than average, some will be faster than average, but most will emit energy at some average value (the peak in the plot). But it’s the spread of these energies that gives us the blackbody spectrum we see.
Second, hotter blackbodies emit more radiation at all wavelengths compared to cooler blackbodies. This is because hotter atoms and molecules vibrate and collide more often, which causes them to give off more energy.
Third, check out the peaks of each temperature blackbody. Other than the height of the curve, what jumps out at you? To me what jumps out is the shift of the peak redward as the temperature of the blackbody goes down. In other words, the peak of the blackbody moves to higher (redder) wavelengths as the temperature decreases.
How does all of this help us with astronomy? Well, it turns out that stars emit radiation like a blackbody! This means that we can use what we know about the blackbody curve to make a thermometer for stars.
There’s a nice mathematical relationship between the wavelength that has the highest intensity in a blackbody and the temperature. It’s one of those important equations that gets a name: Wien’s Law:

This says that the wavelength of maximum intensity (in nanometers) is equal to a constant divided by the temperature (in Kelvin). What this allows us to find the temperature of a star by just measuring its spectrum!
This also means that the color of a star can stand in as a rough approximation of its temperature. Light gets more energetic as its wavelength decreases, and each wavelength corresponds to a particular color. Stars with a max intensity at low wavelength will have hot temperatures, and stars with a max intensity at large wavelength will have lower temperatures. The smaller the wavelength, the bluer the light, and the longer the wavelength, the redder the light. So if we wanted to compare the temperature of a star that appears red to the temperature of a star that appears blue, we could say that the blue star is hotter than the red star just from color alone! Pretty cool!
I got this post in just under the wire for October, but I did do it. I don’t need your praise, I’ve clapped for myself. I hope you stop by next month for more ABCs of Astronomy.