
Ad Astra Blog
I don’t want to live in a world where sunlight is for sale
What a wild sentence to write, and wilder still that there are people who don’t agree with it.
If you’re wondering what would prompt me to write such a sentence, please allow me to introduce you to the Reflect Orbital, whose goals seem straight out of a dystopian novel.
What a wild sentence to write, and wilder still that there are people who don’t agree with it.
If you’re wondering what would prompt me to write such a sentence, please allow me to introduce you to the Reflect Orbital, whose goals seem straight out of a dystopian novel.
Let me say that again: Reflect Orbital wants to use a big mirror to artificially illuminate dark places. For a price, of course.
This is only a proof of concept mission. If all goes well, Reflect Orbital wants to put 50,000 of these giant mirrors into orbit by 2035. If it works, the giant mirrors would project a 3 mile wide beam of light onto the Earth’s surface.
As an astronomer and someone who cares about the night sky and everything living thing that needs it, this is obviously concerning. Both the American Astronomical Society and the Royal Astronomical Society in the UK have voiced objections. Astronomy Magazine reports that harming optical astronomy is only the beginning:
But even if that light is only directed to its target, the satellite would be the brightest ever launched according to a European Southern Observatory (ESO) study. To an observer outside the reflected beam, the satellite would appear as bright as Venus — and inside the beam four times brighter than a full moon. AAS argued in a public statement that the satellite puts research telescopes at risk, could momentarily blind pilots or drivers, and “as Reflect Orbital stated in its own FCC filings — [could cause] potential permanent eye damage to anyone looking through a mid-sized telescope.” Scale that up to a future fleet in the tens of thousands and the danger compounds.
Even more concerning is that this entire endeavor - and commercial launches, specifically - have almost no oversight, at least in anyway that matters. In the US, the Federal Aviation Administration (FAA) covers launch and reentry, the Federal Communications Commission (FCC, the relevant entity here) covers spectrum, and the National Oceanic and Atmospheric Administration (NOAA) covers Earth-imaging satellites. However, no one seems to think they have jurisdiction to look at the possible environmental impacts of missions like the one proposed by Reflect Orbital.
This is all extremely upsetting for astronomy, and nature, and safety. But I’m also just…so tired.
Is nothing sacred? I ask this sincerely.
I was never an outdoor kid. We were a Must See TV family. Camping? Forget it. But as I’ve grown older one of the only things that consistently brings me joy is being outside in nature, or, at the very least, outside of earshot of most of the car noise that constantly surrounds me. It makes me feel like I’m living with the planet, not against it or in spite of it. The impulse to control everything - or even the belief that something like that is possible or desirable - starts to fade. Personally, I feel closer to life on the planet when I’m out in nature. It can feel overwhelming, but it also feels peaceful.
I am also someone who has been pretty online since high school. I remember how things used to be. I remember Homestar Runner. I remember searching before Google (hellooooo Altavista). I remember the advent of YouTube. I remember when you needed a .edu address to get on “The Facebook.”
More to the point, I remember when you could purchase software and actually own it. I remember when you could go to the store and get a disk with 3 license for Microsoft Office and you could just…install it on your computer! And you never needed to do anything else.
I remember when there were shows that you wanted to watch on cable. Now I need to subscribe to a dozen different apps.
I remember when Twitter wasn’t a cesspool of white supremacists. It acted as a news feed, but Weird Twitter acted like a salve when it all became too much. It got me through the pandemic, truly.
I remember when I didn’t need a subscription for a note-taking app on my iPad.
I remember when AI wasn’t crammed down our throats by every single tech company out there.
And now we’re on the verge of needing a subscription for sunlight.
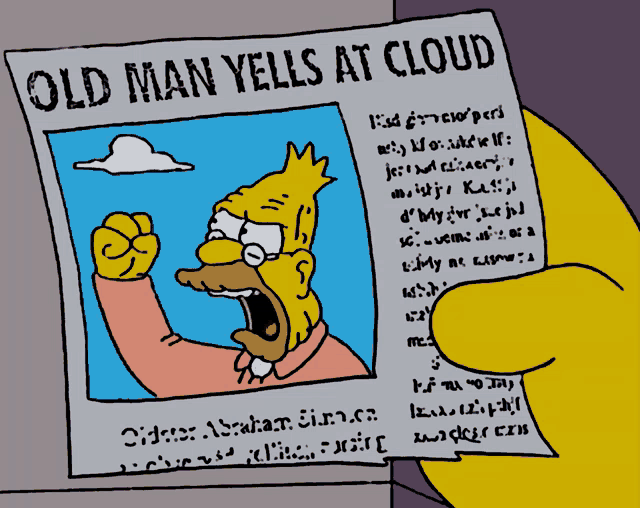
Listen…I know I sound like an old man yelling at clouds. But I can’t look at the long-term goals of Reflect Orbital without thinking about how every day life experiences have gotten worse in the last 15-20 years, and why. We’ve given away so much. Our privacy. Our connection. We have to draw the line somewhere, right?
(If you want to know more about why everything seems worse, I cannot recommend enough the Worse on Purpose newsletter.)
Astronomers like to say that the sky is for everyone. This is an excellent sentiment, but at least since the 20th century that hasn’t been true. Light pollution keeps most people from truly appreciating the beauty of the night sky. But just because it’s not currently true doesn’t mean that it can’t be someday and that we shouldn’t work toward that goal. The idea that there could be a private company - anybody really, but especially an entity that is mostly unaccountable - that not only controls the direction of sunlight, but in the process pollutes an already limited resource offends me to my core.
I get the same feeling looking up at a dark night sky that I do when I’m out in nature. I feel small and alone, in a way that makes any connection I can make with the world and people in it feel fragile and precious. Because it is fragile and precious. I don’t think people pay enough attention to what is above their heads. If they did, would they feel our innate connection? Would they think about what it means to be human living on this small planet? I don’t know. I like to think so, but I don’t know.
Maybe I’m being dramatic. Maybe. But here’s what I know: I know that what I have experienced, having lived most of my life on the internet, has not made me confident about the ability to Big Tech to self-regulate. I know that the cycle of light and dark is as important to ecosystems as water and sunshine. And I suspect that harnessing sunshine in this way will have substantial impacts that we don’t expect because no one has done an environmental impact study.
Call me a Luddite (derogatory) if you must, but I prefer to think of my self as a Luddite (complementary). It’s the fucking Sun, for Christ’s sake.
Astronomy ABCs: F is for the Faber-Jackson Relation and the Fundamental Plane
Aaaaaaand we’re back to regular programming, which means another post in my Astronomy ABCs series. This month we are on the letter F, and what other topic could I possibly choose than the Faber-Jackson Relation and the Fundamental Plane (two “F”s for the price of one!).
Aaaaaaand we’re back to regular programming, which means another post in my Astronomy ABCs series. This month we are on the letter F, and what other topic could I possibly choose than the Faber-Jackson Relation and the Fundamental Plane (two “F”s for the price of one!).
The Faber-Jackson Relation
Way back in the old days of 1976, two astronomers - Sandra Faber and Robert Jackson - published a paper called “Velocity dispersions and mass-to-light ratios for elliptical galaxies.” In this paper they studied 25 elliptical and lenticular galaxies and they realized that the measured velocity dispersions correlated with the absolute magnitude (or luminosity) of the galaxy. In plot form, it looks like this:
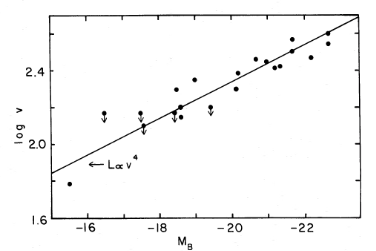
Figure 16 from the Faber & Jackson 1976 paper. Line of sight velocity dispersions are on the y-axis. Absolute magnitudes in the B band are on the x-axis.
Alas, I have used terms like “absolute magnitude” and “velocity dispersion.” I suppose I should explain what those things are before we move on.
Luminosity/Absolute Magnitude
Luminosity and absolute magnitude are related concepts, and often are used interchangeably in astronomy, so it makes sense to talk about them together.
Luminosity is can be thought of as how bright something is, while absolute magnitude is how bright something appears to be from a standard distance (in astronomy that distance is 10 pc). Luminosity is a measurement of how much energy is being released per unit time. If we’re talking about something like a light bulb, it’s luminosity would me reported in Watts. In astronomy, we talk about luminosity in terms of how it compares to the Sun (“solar luminosity).
Absolute magnitude is a measure of an object’s luminosity. It’s how bright the object would look if we were 10 pc away from it. (As far as I know, this 10 pc is arbitrary, but you have measure against something.) It’s measured on a logarithmic scale. If two objects have a difference of 5 magnitudes in brightness, that actually means that the ratio of their luminosities is 100. Also, the lower the absolute magntude is, the brighter it is. Something with a negative absolute magnitude is brighter than something with a positive absolute magnitude. It’s all a little messy, but these are both measurements of how bright something is. Not to be confused with apparent magntude, which is how bright something looks, which can vary a lot with distance and other things (think about how a light bulb looks dimmer when it’s far away compared to when it’s right next to you).
Velocity Dispersion
I think most of use have some experience with bright things. Light bulbs, the Sun, my personality…luminosity and apparent magnitude might not be the words we use every day, but the concepts are familiar. That probably is not the case with velocity dispersion.
Let’s think about a single star. It will have a spectrum that might look something like this:
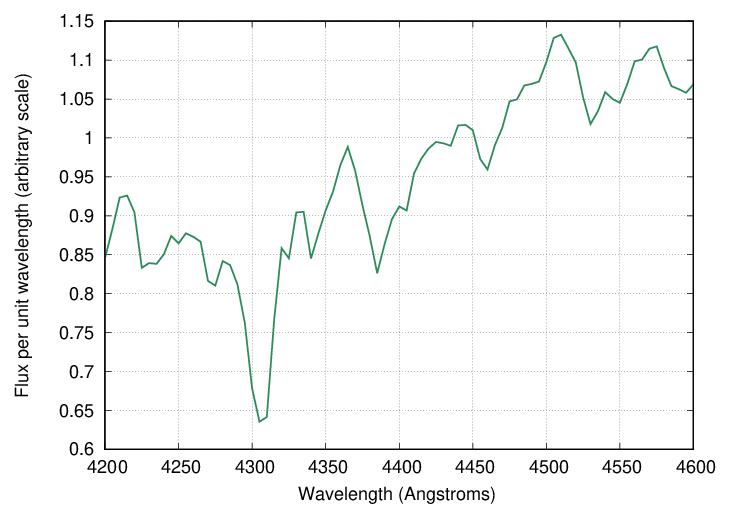
Sample stellar spectra taken from here. The y-axis is basically how much light is being detected and the x-axis is the wavelength of light. This type of graph shows how much light is coming through at each wavelength.
This is zoomed in and only shows a small range of wavelengths, but that’s fine.
This is great, but everything in the Unvierse is moving relative to us here on Earth. This causes the spectrum to undergo a Doppler shift, which will shift the spectrum to either bluer or redder wavelengths, depending on it’s velocity. If the star is moving toward us, the light will look bluer. If it’s moving away the light will look more red. Below is how the spectrum seen above would compare to those shifted values:
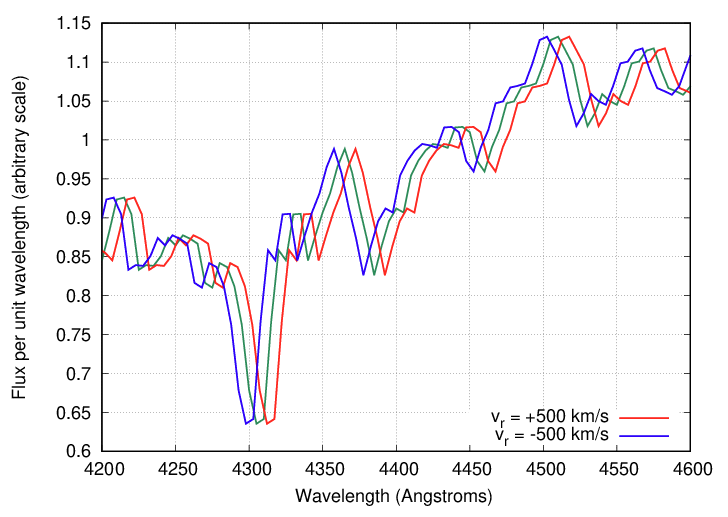
Doppler shifted spectra taken from here. Axes are the same.
The blue line represents a star moving toward us at 500 km/s, the green line is the original star that we assume is not moving relative to us at all, and the red line is a star moving away from us at 500 km/s. The amount of shift we see is very dependent on how fast the star is moving, but you can kind of see what I’m talking about. The movement shifts the spectra.
Getting spectra from an astronomical object is a wonderful thing. A spectrum is like a fingerprint. Every atom and molecule has distinct lines (those dips and peaks). They are so regular that we can name what an object is made of, just by looking at the spectral lines. If those lines are shifted from where they would be normally, we know the object is moving.
This is fine for an individual star, but how does this work with galaxies. Galaxies are combinations of millions or billions of stars. In elliptical galaxies, those stars are orbiting the center of the galaxy is random directions. Some are on a part of their orbital path that moves toward us, some are moving away. Some are only moving sideways. When we get a spectrum of a galaxy, we get a combination spectrum of all of the galaxy’s stars. Calculating the velocity dispersion of a galaxy is kind of like plotting the velocities of all the stars in it and figuring out the standard deviation of that distribution.
The Faber-Jackson Relation, revisited
What Faber and Jackson did in their 1976 paper was measure the velocity dispersions and absolute magnitudes of several elliptical galaxies and found that they correlated; that is, galaxies with larger velocity dispersions also tended to be more luminous.
What’s cool about this is that you can use it to calculate extragalactic distances. Distance measurement has always been kind of pain in astronomy. Things are so.far.away. One way we can calculate distance is through something called the distance modulus:
m - M = 5 log(d) - 5
where m is the apparent magnitude (how bright something looks), M is the absolute magnitude (how bright something is), and d is the distance you want to find. Figuring out how bright soemthing looks is easy. Figuring out how bright something is…well, that’s tougher. But with the Faber-Jackson Relation, if we can measure the velocity dispersion of a galaxy, we can make a pretty good estimation of it’s absolute magnitude, and from there all we have to do is plug and chug and we have a not-too-bad estimate for distance!
Fundamental Plane
Faber and Jackson also found a correlation between velocity dispersion and mass-to-light ratios. The mass-to-light ratio is the ratio of the total mass of a galaxy (normal matter, no dark matter) and the total energy output of the galaxy (it’s luminosity). Faber and Jackson found that the more luminous the galaxy, the higher its mass-to-light ratio. And since they also found that luminosity is positively correlated with velocity dispersion, we now know that the larger the velocity dispersion, the larger the mass-to-light ratio.
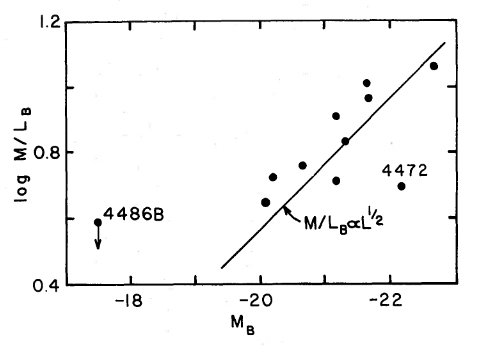
Figure 17 from the Faber & Jackson 1976 paper. Mass-to-light ratios are on the y-axis. Absolute magnitudes in the B band are on the x-axis.
A lot of characteristics of normal elliptical galaxies have shown to be correlated, including the radius of the galaxy, its surface brightness, as well as velocity dispersion. Because there are three variables instead of just two, astronomers call this the fundamental plane (apparently coined by Djorgovski & Davis 1987). Any two variables can predict the third. Amazing!
These findings are a big deal in extragalactic astronomy. It showed that normal (non-dwarf) elliptical galaxies are a class of object all their own.
Featured image credit: Elliptical Galaxy IC 2006 by ESA/Hubble
You should celebrate Dark Sky Week in your not-so-dark town
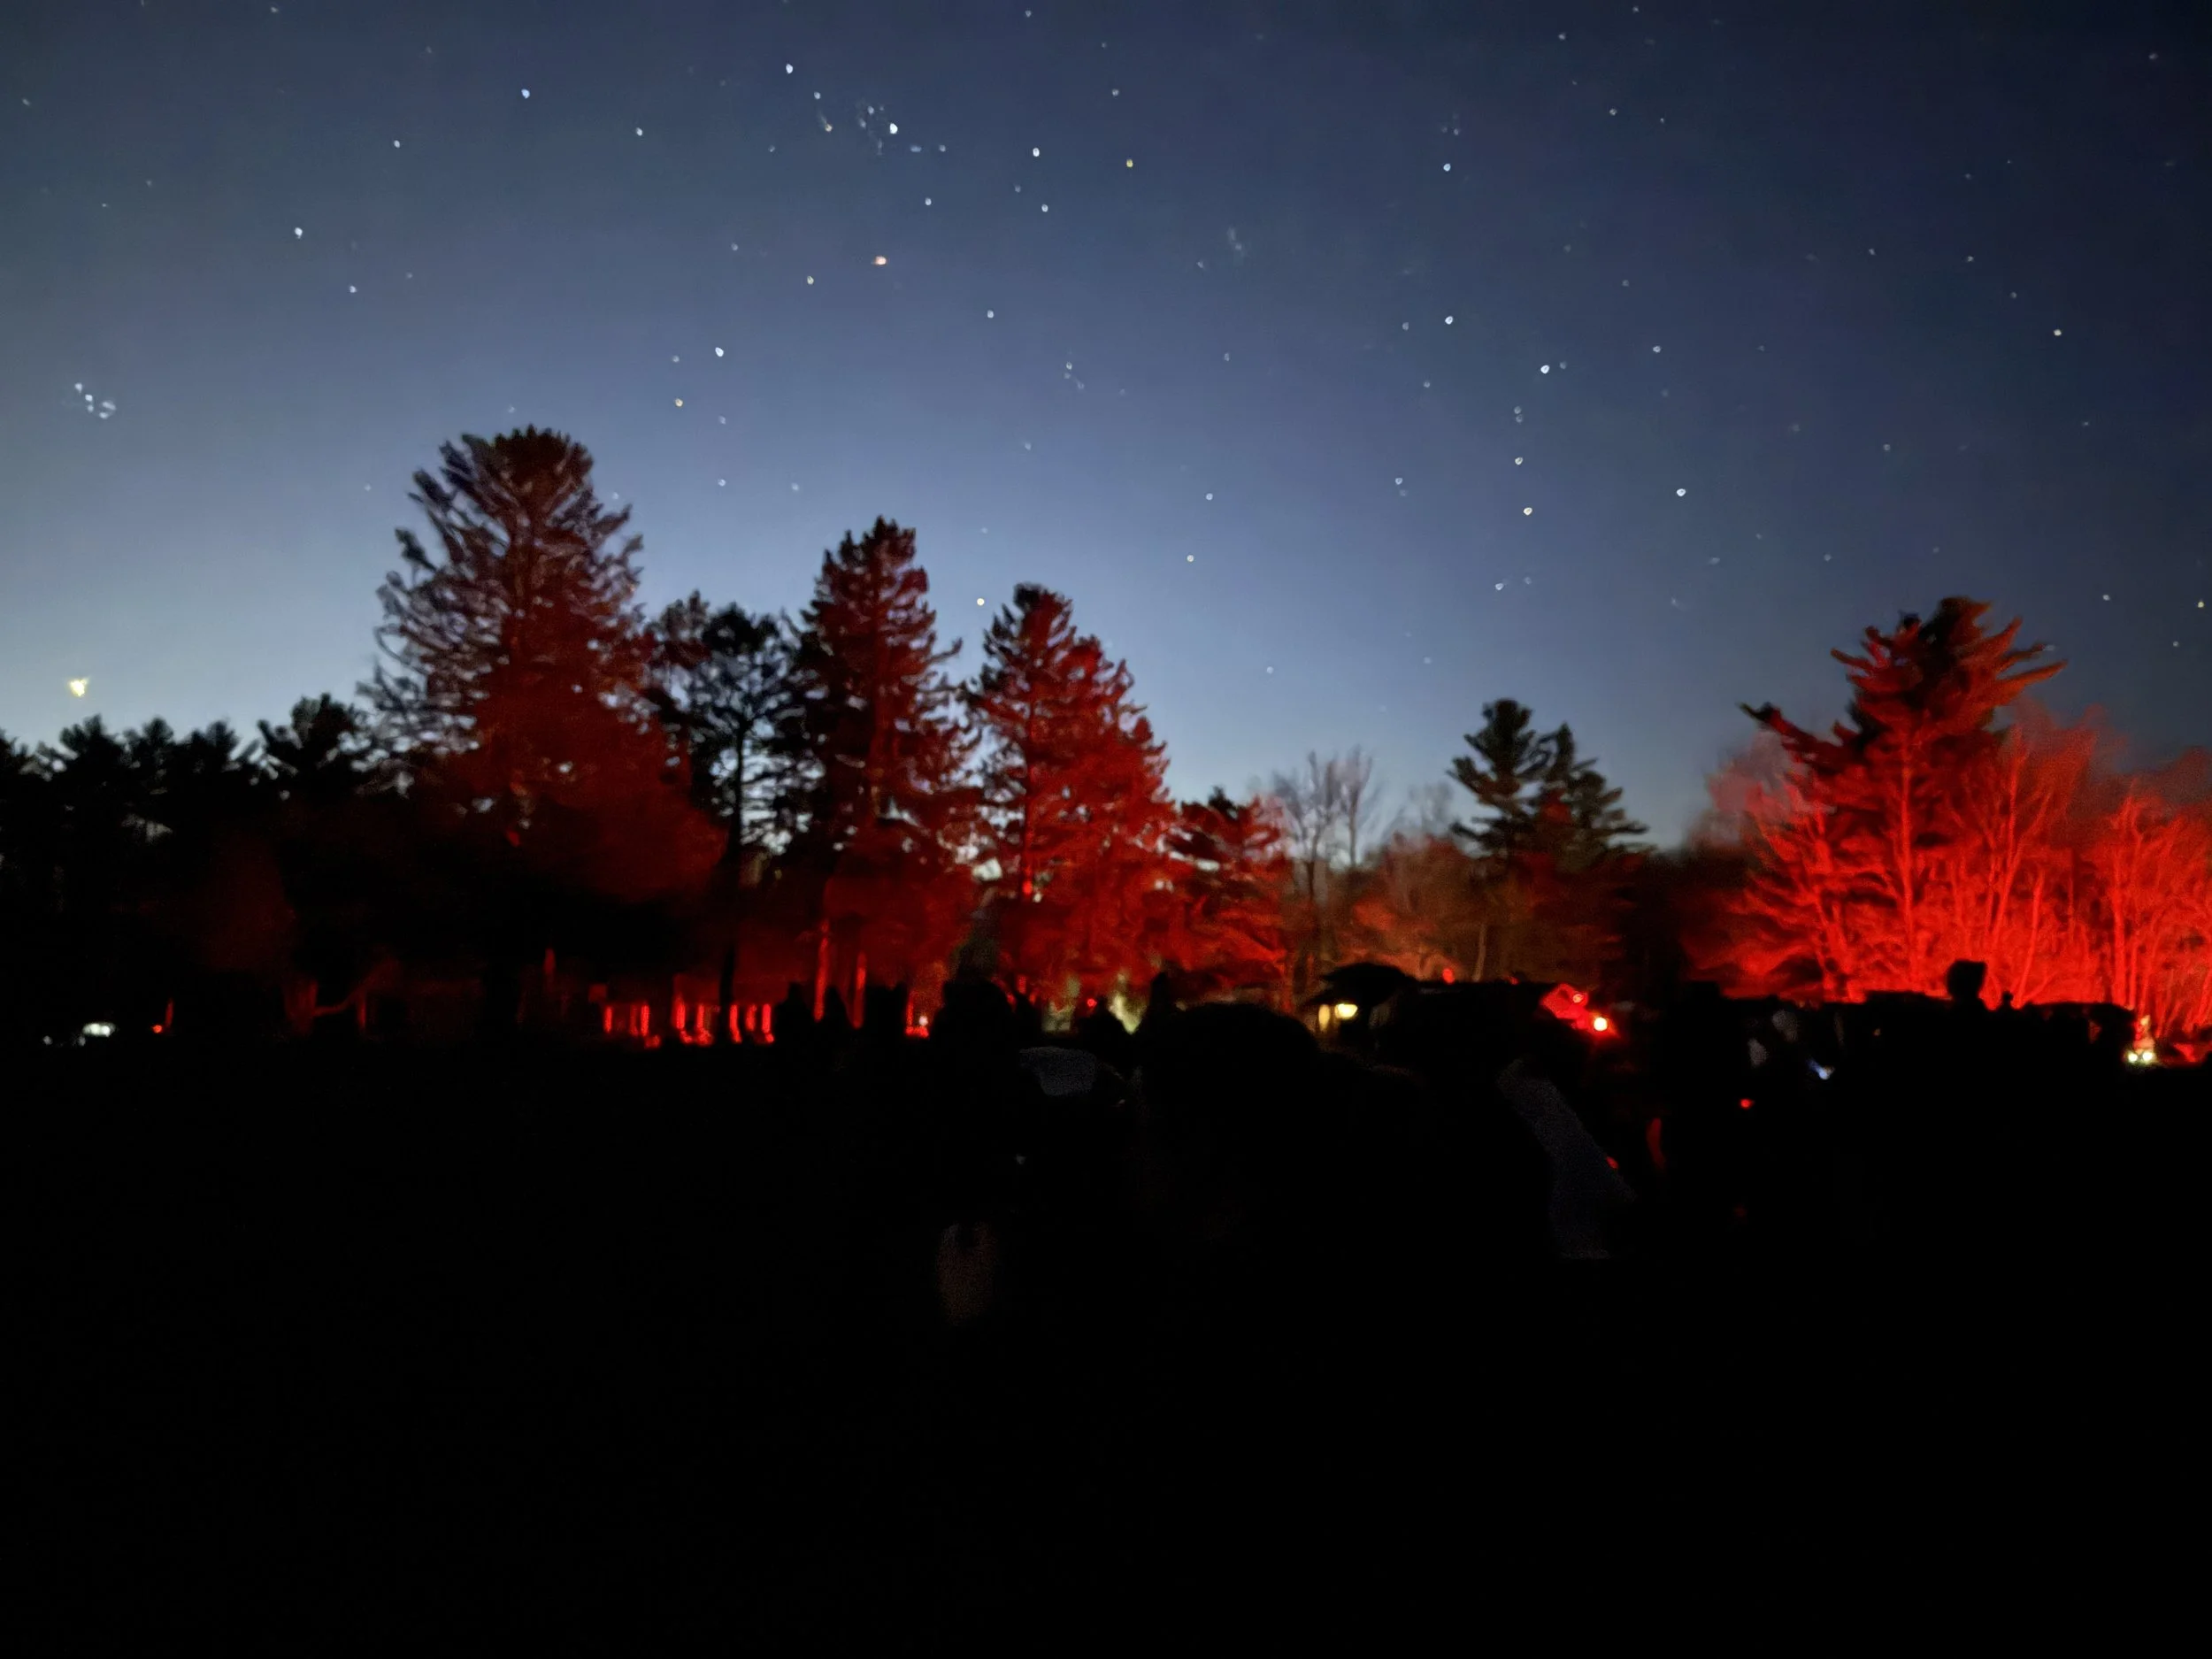
First of all, I know I missed April. I had a lot going on. One of those things was the first Capital District Dark Sky Week.
First of all, I know I missed April. I had a lot going on. One of those things was the first Capital District Dark Sky Week.
International Dark Sky Week is nothing new. IDSW was started as National Dark Sky Week in 2003 by Virginia high school student Jennifer Barlow as an effort to draw attention the beauty, function, and fragility of truly dark skies. Now it’s spearheaded by DarkSky International and is held during the week of the new moon during April (which also happens to be Global Astronomy Month). There are events held all over the world, mostly in the places you’d expect - places with dry air and little light pollution.
Where I live in upstate New York is not known as being a particularly nice place for stargazing. There are some dark spots, but nothing extraordinary. It’s also cloudy and/rainy approximately one thousand percent of the time, so astronomy is one of the more frustrating hobbies you can have here.
Dark skies and light pollution are usually associated with astronomy, and for good reason. Astronomers started the leading dark sky preservation organization, and, despite the existence of space telescopes, most of professional astronomy is done from the ground. Astronomers notice a brightening of the night sky earlier than most.
But it would be a mistake to assume that astronomers are the only people who care - or should care - about preserving dark skies. In fact, light pollution - the excess artificial light that changes natural patterns of light and dark - impacts a wide range of animals and plants. Scientists are just starting to grapple with the impact of light as an environmental pollutant.
It’s with this in mind that I organized a week of educational programs that I organized the first Capital District Dark Sky Week in upstate New York. I’m deeply jealous of places like Flagstaff and the Grand Canyon in Arizona, Badlands in South Dakota, and any number other dry places out west where you can reliably schedule star parties and be reasonably sure the sky will cooperate. That’s not true in New York, where it’s cloudy more often than it isn’t. But preserving dark skies is not about preserving astronomy, only. It’s about making sure that we aren’t haphazardly making it harder for other living things to thrive.
In my experience, light is not considered something that should be used sparingly. We live in 2026, we have plenty of light! We can shine it all around! But, like other modern conveniences, using too much can have unintended impacts. My hope with this program was to bring this to the attention of nature-lovers of all stripes who may or may not care much about astronomy. We are allies in this. Whether you want dark skies to help birds, plants, or stars, we get to the same place.
If you don’t live in a dark sky area, organizing an event like this can seem daunting. Luckily, you don’t have to reinvent the wheel. You don’t even have to be a subject-matter expert. Find organizations in your area that do nature conservation work. They may know someone who can speak on nocturnal wildlife. What about your local amateur astronomy group? They may be able to help with star parties. The more local orgs you can bring into this, the better. They can help with planning and advertising. In the end, you have a great community who may not have talked much before but now have a common interest.
It doesn’t take a big organization to put on a quality event. You don’t even need dark skies to promote International Dark Sky Week (half of our star parties were clouded out).
The next International Dark Sky Week is April 5-11, 2027. Even if it’s just a special star party with your local astronomy group, there is literally nothing stopping you from making it a special and en-dark-ening time for your community.
Astronomy ABCs: D is for Debris Disk
Happy Honda Days, everyone! It’s December, which start with D, which is also the next letter in Astronomy ABCs! And this month D is for debris disk!
Happy Honda Days, everyone! It’s December, which start with D, which is also the next letter in Astronomy ABCs! And this month D is for debris disk!
A debris disk in astronomy is pretty much what it sounds like: a disk made up of debris from some formation process that orbits a celestial body. Usually astronomers talk about debris disks when discussing the formation of planets around a star, so a debris disk in this case would be the gas and dust left over from the formation of a star that orbits that star in a disk.
A debris disk shouldn’t be confused with a protoplanetary disk. Protoplanetary disks have much more gas, but in debris disks this dust is nearly gone. Protoplanetary disks also tend to be found around younger stars than debris disks, leading to the hypothesis that protoplanetary disks evolve into debris disks over time. The link between protoplanetary disks and debris disks is an active area of research.
The term “debris disk” sounds like what is left after something catastrophic happens. And really, I guess that’s true! But not catastrophically bad. It’s the natural consequence of the formation of stars.
Stars form out of clouds of hydrogen gas and dust called nebulae. A star-forming nebula like the Orion Nebula will form many, many stars. In the very earliest stage of a star’s life, it is still surrounded by an envelope of gas and dust. This material will form planetesimals (basically a general term for small bodies like asteroids and comets), which will continue to collect material until they form planets. This might go on for a few tens of millions of years, but the pressure from the radiation given off by the star will eventually clear out all the teeny tiny bits. But this is just the beginning of the debris disk. Collisions between these planetesimals may cause a second generation of dust in the system.
OK, so we have these planetesimals flying around, potentially crashing into each other and creating dust that turns into a debris disk. Dust grains in a debris disk tend to be about 10 microns wide at their biggest. For reference, a human hair is something like 50 microns wide, so these dust grains are pretty tiny. These tiny grains will further collide to make even smaller, sub-micron sized pieces that won’t stick around the system for long. These dust grains could also spiral into their host star. These processes mean that, without any process to replenish it, the debris disk will only last about 10 million years. However, the cycle of collisions often keeps the debris disk around for longer.
Studying debris disks around other stars can shed light on the formation of our own solar system, but it’s also especially relevant for astronomers who want to find exoplanets, or planets around stars that are not our Sun. You see, for collisions to happen, planetesimals need to have their orbit altered in some way. Gravitational perturbations can draw two objects together and bam! Collision. The central star could cause this, as could a second star in a binary star system. But you know what else could cause these perturbations? Planets. So how can astronomers narrow down where to look for planets? Find systems with a debris disk. These systems are easier to spot and, while it doesn’t guarantee a planet exists there, it increases the odds.
Even though debris disks are easier to find than individual exoplanets, they are still difficult to find. Because of the thermal emission properties of dust grains, usually debris disks are detected with telescopes designed to detect relatively cool things out in space. It’s hard to believe that we can actually use telescopes on Earth to see other stars in enough detail to make out their disks and, possibly, detect planets. I’m never not astounded by what we’re able to learn!
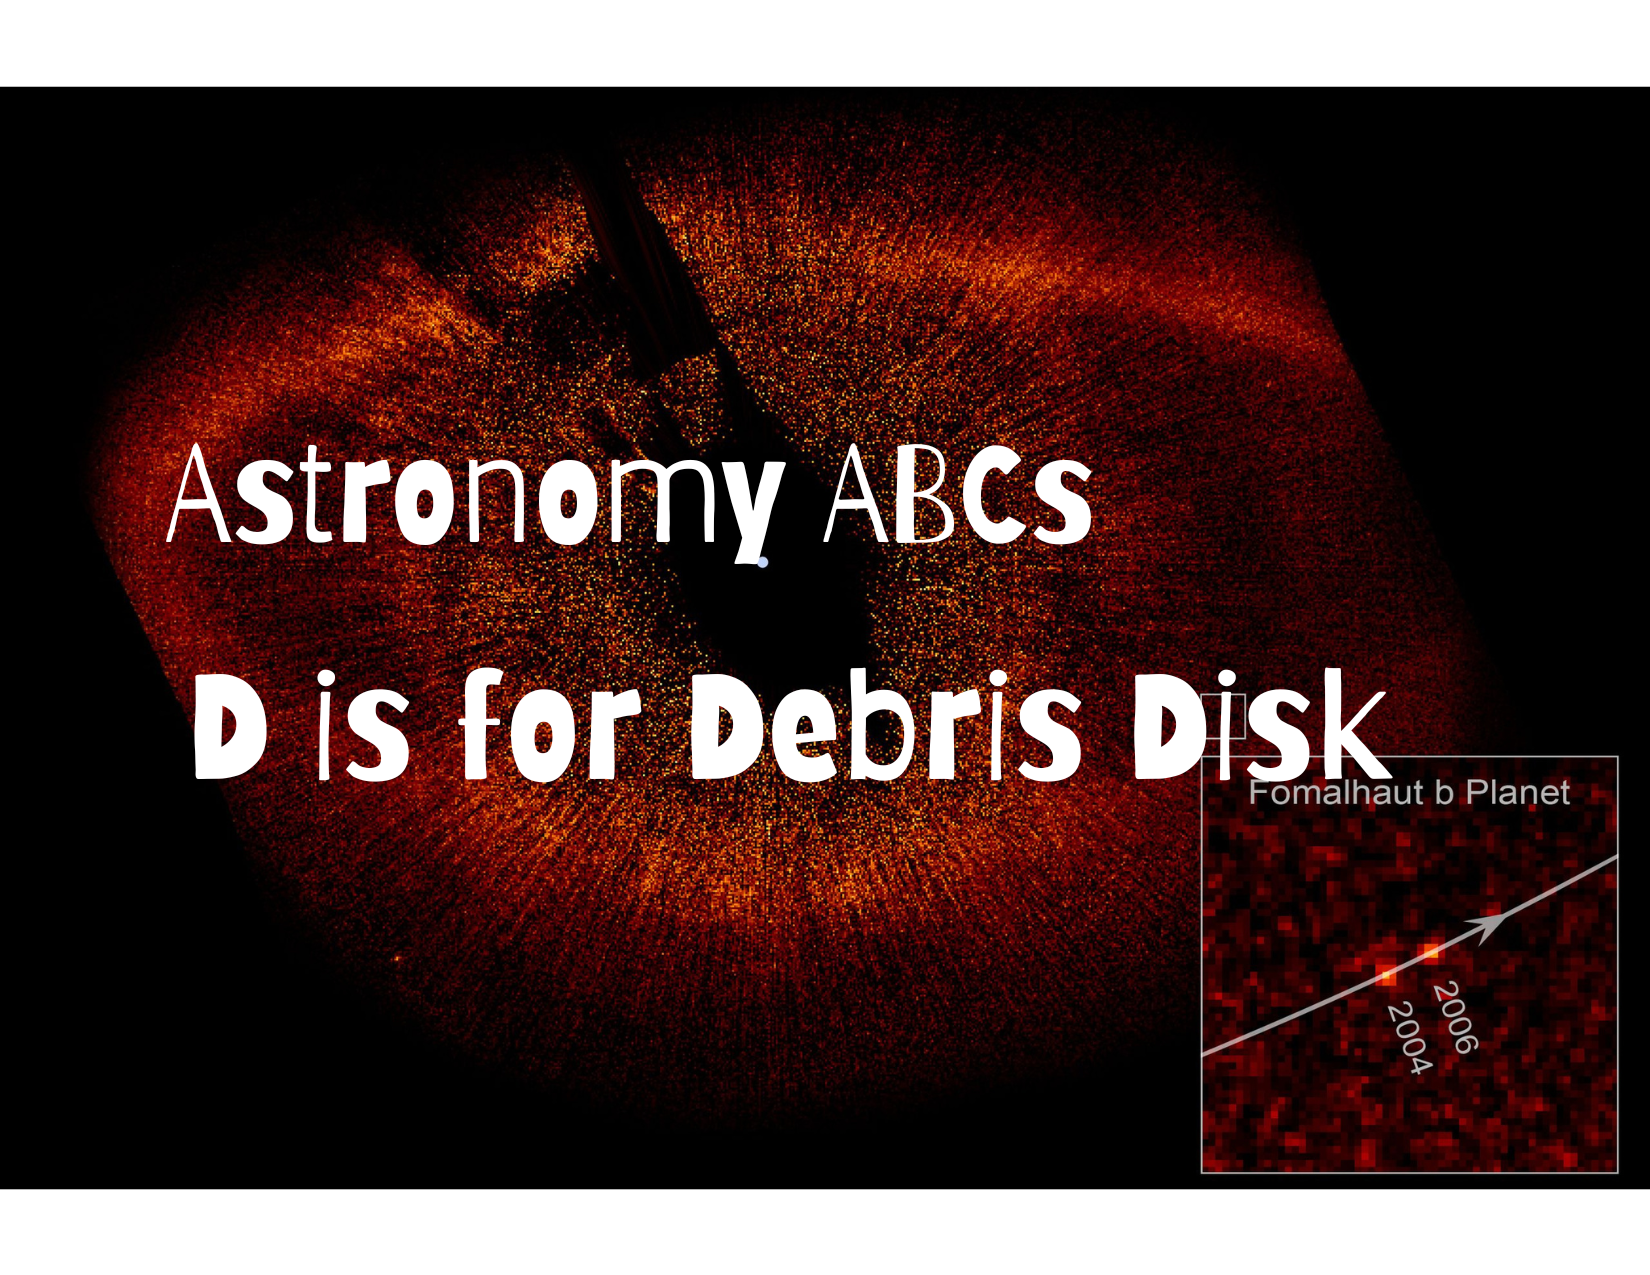
Featured image credit: NASA, ESA, P. Kalas, J. Graham, E. Chiang, E. Kite (University of California, Berkeley), M. Clampin (NASA Goddard Space Flight Center), M. Fitzgerald

Astronomy ABCs: B is for Blackbody Radiation
Ah, hello. It is a new month and here I am, trying to fulfill the promise I made to myself to write about astronomy every month. Rather than try to come up with something very clever to write about, I decided to use the English alphabet to guide my way. Last month - the first month of this journey - was A, which of course stands for Astronomy. As is customary, B follows A, so this month let’s dig into blackbody radiation.
Ah, hello. It is a new month and here I am, trying to fulfill the promise I made to myself to write about astronomy every month. Rather than try to come up with something very clever to write about, I decided to use the English alphabet to guide my way. Last month - the first month of this journey - was A, which of course stands for Astronomy. As is customary, B follows A, so this month let’s dig into blackbody radiation.
So…what’s a blackbody? A blackbody is an object that absorbs all light that hits it and emits thermal radiation. Atoms in the blackbody will start to heat up and vibrate faster and faster. As it heats up it will emit electromagnetic radiation - aka light - until the absorption and emission are in balance, i.e. it is in thermal equilibrium with its surroundings.
The radiation from a blackbody has three characteristics that make it useful in astronomy. Check out the plot I shamelessly stole from the OpenStax Astronomy textbook.
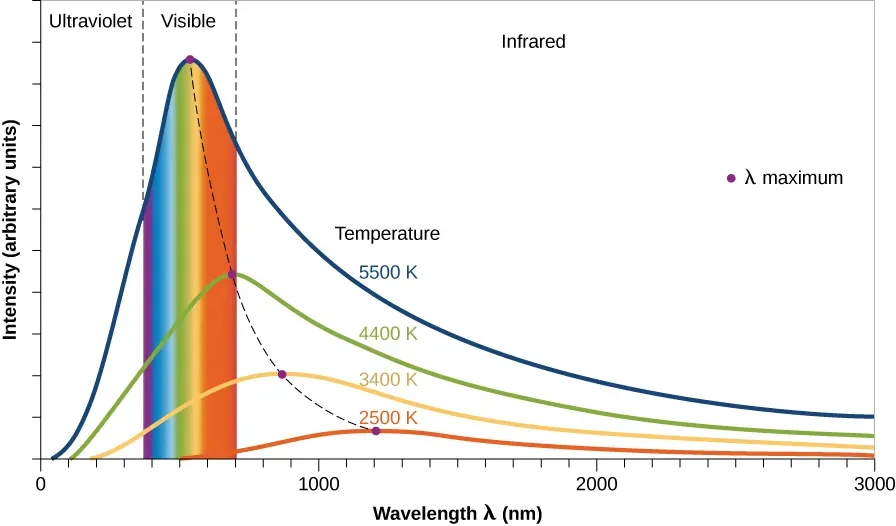
Blackbody radiation illustrated for several temperatures.
This plot shows the blackbody radiation curve for different temperature objects. The vertical axis is intensity - basically how many photons our objects are emitting - and the horizontal axis is wavelength.
There are a few things to notice about the blackbody radiation curve:
First, the spectrum is continuous. These blackbodies are emitting photons at all wavelengths at once (but not all equally, which is important). These blackbodies are just bundles of atoms and molecules. These atoms and molecules will vibrate and bump together at varying speeds. Some will slower than average, some will be faster than average, but most will emit energy at some average value (the peak in the plot). But it’s the spread of these energies that gives us the blackbody spectrum we see.
Second, hotter blackbodies emit more radiation at all wavelengths compared to cooler blackbodies. This is because hotter atoms and molecules vibrate and collide more often, which causes them to give off more energy.
Third, check out the peaks of each temperature blackbody. Other than the height of the curve, what jumps out at you? To me what jumps out is the shift of the peak redward as the temperature of the blackbody goes down. In other words, the peak of the blackbody moves to higher (redder) wavelengths as the temperature decreases.
How does all of this help us with astronomy? Well, it turns out that stars emit radiation like a blackbody! This means that we can use what we know about the blackbody curve to make a thermometer for stars.
There’s a nice mathematical relationship between the wavelength that has the highest intensity in a blackbody and the temperature. It’s one of those important equations that gets a name: Wien’s Law:

This says that the wavelength of maximum intensity (in nanometers) is equal to a constant divided by the temperature (in Kelvin). What this allows us to find the temperature of a star by just measuring its spectrum!
This also means that the color of a star can stand in as a rough approximation of its temperature. Light gets more energetic as its wavelength decreases, and each wavelength corresponds to a particular color. Stars with a max intensity at low wavelength will have hot temperatures, and stars with a max intensity at large wavelength will have lower temperatures. The smaller the wavelength, the bluer the light, and the longer the wavelength, the redder the light. So if we wanted to compare the temperature of a star that appears red to the temperature of a star that appears blue, we could say that the blue star is hotter than the red star just from color alone! Pretty cool!
I got this post in just under the wire for October, but I did do it. I don’t need your praise, I’ve clapped for myself. I hope you stop by next month for more ABCs of Astronomy.

Astronomy ABCs: A is for Astronomy
I used to write the way I breathe. It was effortless. I would have a thought and I would write it down, which changed very little in the distance between my head and my fingers. I haven’t written much in a while, though I’ve tried to create systems that encourage it. I really did want to learn and write a bunch about Venus, but…well. You can see how that turned out.
I used to write the way I breathe. It was effortless. I would have a thought and I would write it down, which changed very little in the distance between my head and my fingers. I haven’t written much in a while, though I’ve tried to create systems that encourage it. I really did want to learn and write a bunch about Venus, but…well. You can see how that turned out.
Part of my job is writing a monthly public science talk. Every month I choose a topic and write a roughly hour-long presentation on it. I script out every talk. I know that this isn’t necessarily “good” practice among scientists, but I do it for a couple of reasons:
I get really nervous when I’m speaking. A script is like a security blanket. If/when I get so nervous that I forget the point of the slide, I have something to fall back on.
The script is a little gift to future me. Once a talk is written, I’ll give it whenever. It’s on the schedule for a certain month but if a group wants to hear it 4 months later, who am I to say no? I write a script because I know I am forgetful. A script allows me to pick up the talk months later and know exactly what I meant to say.
It just helps me weave a story. The flow from slide to slide is better.
I’ve been in this position for a little over 2.5 years and I’ve written 36 individual talks, most of them hour-long public lectures. I was curious to see how much writing a year of public lectures was, so I counted up every word of each of the 12 scripts I wrote in 2024. The result: 65,491 words. A 200 page book - depending on page size and formatting - is 50,000 to 60,000 words.
Ah! No wonder I haven’t been writing more on my own! I wrote a book last year. And, since my 2025 lectures are roughly the same length as my 2024 lectures, I’m sure I’m well on my way to writing a book this year, too.
I really thought I had lost any skill I had as a writer because I couldn’t turn it on at a moment’s notice. But seeing the amount I wrote last year compiled in one place made me think that maybe I’m just trying to force myself to write about things that don’t fit into my life right now. If I may say so, the lectures I wrote are good. I think I explain complex things pretty well to a lay audience.
All of this was a long preamble before introducing a new series: Astronomy ABCs. Every month gets a letter and I will write at least one piece on an astronomical concept that begins with that letter. Why should you trust me when I have failed so many times before? I don’t know, maybe you shouldn’t. But I did spend an hour yesterday making a list of topics organized alphabetically. Do with that what you will.
The best place to start in the alphabet is the beginning, and for English that letter is A. A is for Astronomy.
And listen, I thought about this. A could have been for Accretion Disks. Or AGN. Or Asteroid. Or Airy Disk. But if I’m going to start a series of astronomy-themed posts, I thought it might be a good idea to talk about what astronomy is.
Astronomy (or astrophysics, if you prefer) is the scientific study of space and the objects and phenomena we see there. It brings together physics, math, chemistry, geology, and computer science to figure out how galaxies, planets, and the Universe itself works. There are many subfields in astronomy - cosmology, extragalactic astronomy, planetary science, exoplanet astronomy, stellar astronomy, the list goes on - but if it studies something in space, I consider it under the umbrella of astronomy.
Astronomy is also incredibly old. Early civilizations used observations of the sky to keep track of days, months, and seasons, many developing a complex mythology that encodes generational astronomical knowledge.
With a few exceptions, astronomy is an observational science. At least right now, we can’t travel to a nebula and gather a sample of cosmic dust and gas to study. We need to view our subjects from afar using telescopes that are sensitive to different wavelengths of light. The closest we can get to bringing a bucket of star back to Earth is using telescopes to gather light from far off objects as it travels in our direction.
Over the next several months I plan to write explainers on astronomical topics ranging from the small to the very, very large, from close by to very far away, from massless to massive. Some topics I’ve identified are topics I know well. Others…less so. If I do this right then we all learn something.
Next month is the letter B. What will I write about? Black holes? Blue stragglers? The Big Bang? Something else? Check back to see!