Astronomy ABCs: E is for Electromagnetic Radiation
Wow, March nearly got away from me. What with planning Capital District Dark Sky Week, keeping caught up with grading, and taking the portable planetarium around to schools, I’ve only just kept up with things this month.
But it is March 31, not too late for another installment of Astronomy ABCs. This month’s letter is E so let me write a little something about electromagnetic (EM) radiation.
Electromagnetic radiation sounds a bit scary, so maybe I should call it by it’s other name: light.
Light is a tricky thing. We can describe it as both a particle - a photon - and a wave. But when we talk about EM radiation, we are definitely talking about light’s wave-like properties. EM radiation is radiation consisting of waves propagated through regularly varying electric and magnetic fields and traveling at the speed of light. Electricity and magnetism are very closely related. Changing a magnetic field can change an electric current, and changing an electric current can induce a magnetic field! When an electric charge moves back and forth, it creates a pattern in both the electric and magnetic fields that spread out through space, creating an EM wave.
OK, so light acts like a wave. What does a wave act like? You can think about sound waves, or waves in water. Waves have a couple of different properties that correspond to different things. The two big ones are the wavelength and the frequency.
Let’s think about a water wave. Below is a diagram of such a wave.
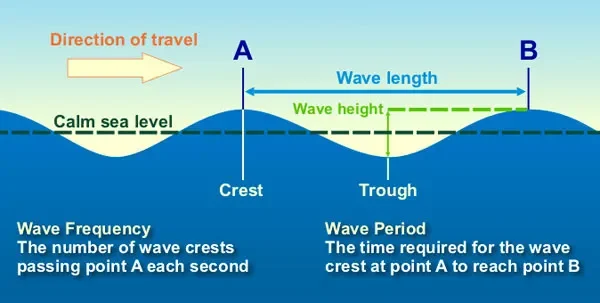
Diagram of a water wave. Image credit: NOAA
The wavelength is basically just what it sounds like: it’s the length of an individual wave, usually measured either from highest point to highest point (crest to crest) or from lowest point to lowest point (trough to trough). The wave frequency is how many waves pass between two points each second. In this image, it would be how many waves pass between point A and point B in one second.
This is similar to EM waves. Even though the waves themselves might look different, EM waves have a wavelength and a frequency, and these are related.
Take a look at the image below.
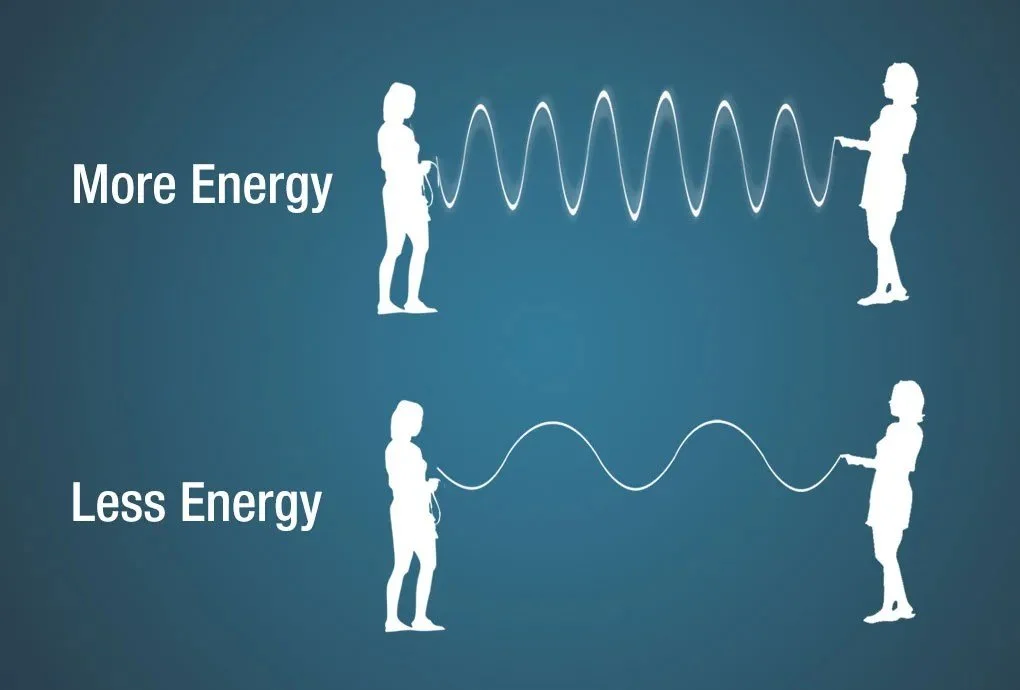
An illustration of how frequency and wavelength reflect the energy of an EM wave. Image credit: NASA
Light with a bigger frequency - that is, light that has more waves going through point A and point B in 1 second - has more energy than light with a smaller frequency. And the wavelength impacts the frequency. Light whose wavelength is long will not have a high frequency because it has fewer waves to pass point A and point B.
EM radiation comes in many different wavelengths and frequencies. Some wavelengths are the size of atoms, others can be kilometers long! Taken together, all of these wavelengths are known as the electromagnetic spectrum.
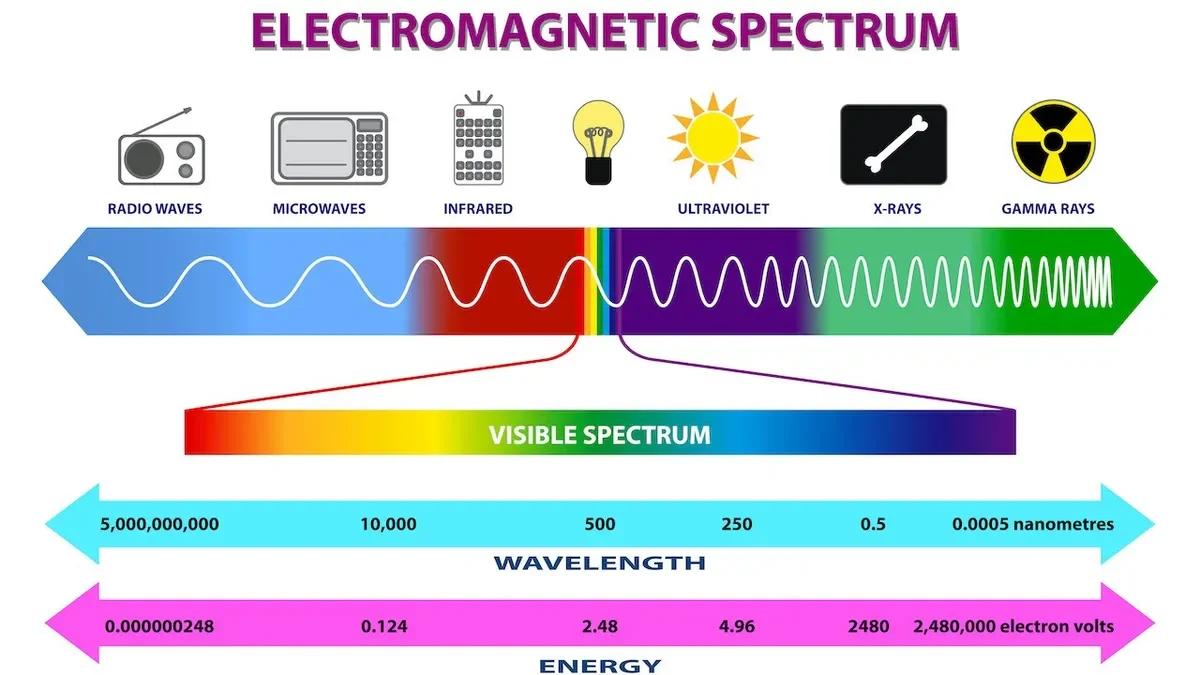
A diagram of the electromagnetic spectrum. Image credit: Getty Images
The diagram above illustrates how this plays out. To the left are low energy EM waves. The energy - or frequency - goes down as the wavelength gets larger.
Smack in the middle is the visible part of the spectrum. This is the small sliver that we can actually see with our eyes. Different wavelengths of light correspond to different colors. Red light is on the low energy end of visible, and blue/purple is on the high energy end. Notice that to the left of red is light called “infrared” and light to the right of violet is called “ultraviolet.” Infrared means “below red” and ultraviolet means “above violet.”
As you go to the right, the light gets more and more energetic. Its wavelength gets smaller but its energy shoots through the roof! High energy light can be dangerous to life. Ultraviolet light is why we get sunburns.
I want to note one thing that might get lost in all this explanation: EM radiation always travels the same speed in empty space, regardless of its wavelength or frequency. The speed of light is the speed of light. It’s tempting to think that high frequency light travels faster than low frequency light, but it doesn’t.
OK, so it’s cool to know that there are lots of different wavelengths of light to look at, but so what? Well, it turns out that this is very important for astronomy. Until very recently, basically all astronomers could do was analyze light to understand what was going on in the Universe, and it turns out that not all of this light can reach our telescopes on Earth.
Stylized graphical representation of which electromagnetic wavelength regions are blocked by Earth's atmosphere. Image credit: Wikimedia Commons
Above is a plot of atmospheric opacity vs wavelength of light. Opacity is just how far down can we see into something. If something is completely opaque, then we can’t see through it. If it’s totally transparent, we can see all the way through. There are shades of grey in between that we can think of as opacity. Earth’s atmosphere is completely transparent to some wavelengths of light and completely or mostly opaque in others. For example, visible light gets through our atmosphere fine. If it didn’t, we wouldn’t be able to see! The same is true for radio waves. Astronomers can observe the sky in radio waves from the ground with little trouble. But that’s not true for the high energy waves, like gamma rays, x-rays, and most ultraviolet rays. And this is good! That light is too high energy and is dangerous for life. We need to observe in these wavelength bands from space. The same is true for light in the infrared. Our atmosphere absorbed most of that light, so we need to observe infrared light from space. In fact, this is the light observed by the James Webb Space Telescope!
To understand why it’s so important to be able to observe in many different wavelengths you need to look no further than the Crab Nebula. The Crab Nebula is a supernova remnant, the leftovers of a massive star that exploded 1,000 years ago. The animation below cycles through images of the Crab in 5 different wavelengths.
The Crab Nebula in 5 different wavelength bands. Red is radio, yellow is infrared, green is optical, blue is ultraviolet, and purple is x-rays. Image credit Wikipedia
Each color represents a different wavelength band: Red is radio waves, yellow is infrared, green is optical, blue is ultraviolet, and purple is x-rays. The final image is all wavelengths stacked on top of each other. This gif doesn’t represent changes over time. It exposes how the same object looks different depending on what kind of light we are looking at. And viewing different kinds of light gives us insight into what types of processes are happening inside this object and what had to happen to produce the thing we see. We simply don’t get the entire picture until we can see in all wavelengths.
Join me next month when I’ll talk about…something that starts with F! What will it be? Even I don’t know. We’ll find out together.